Run to run comparison can be made with the visualisation tool.
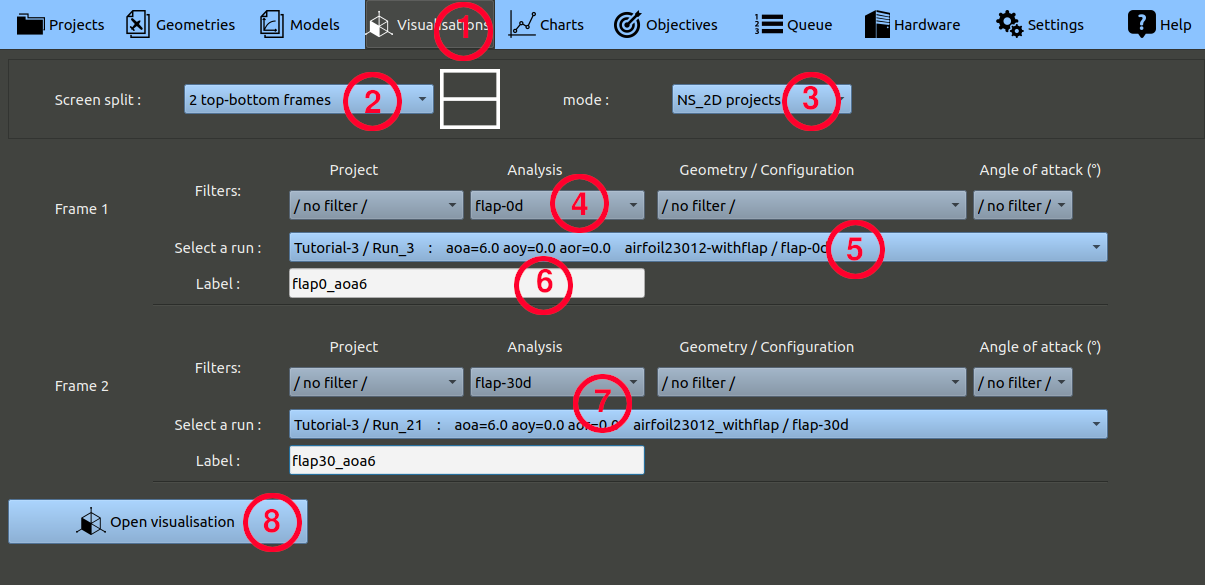
- In the top menu bar, click the 'Visualisations' button
- Set the screen split parameter to "2 top-bottom frames"
- Check the mode is set to "NS_2D_projects"
- Set a filter on the analysis name of your first analysis (0° flap), this helps finding the right run in the following list.
- Choose the run with an angle of attack of 6° for example.
- Set a label value, i.e. a name that will displayed for this run.
- Proceed similarly to choose the second frame run.
- Click the 'Open visualisation' button.

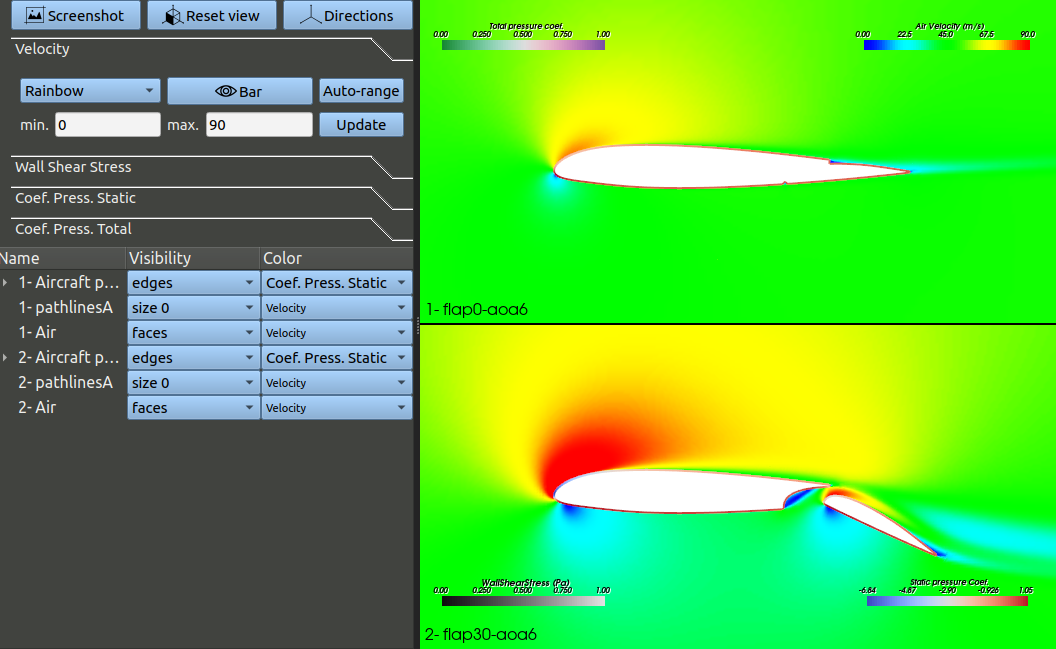
A visualisation window will be opened with two frames so that you can easily compare the flow in the two cases.

You can also compare aerodynamic polars by using the charts tool.
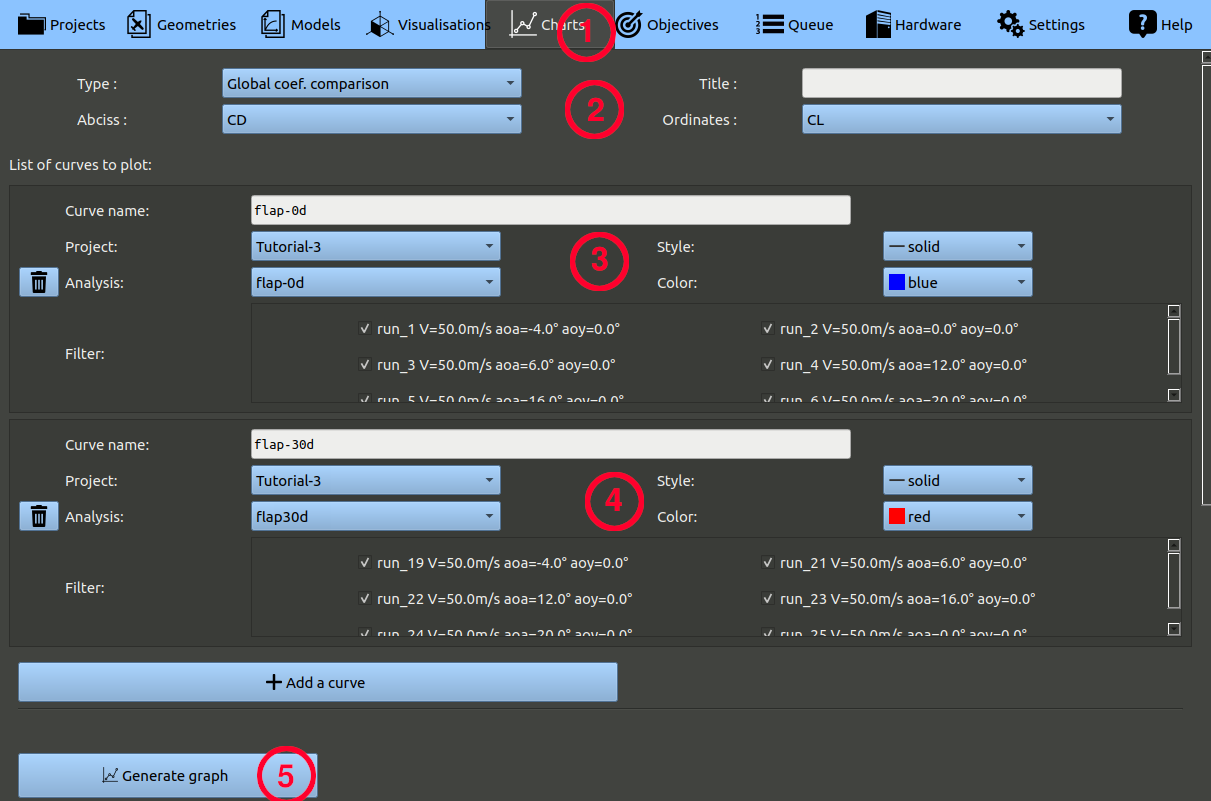
- In the top menu bar, click the 'Charts' button
- On the top, set a "Global coef.comparison" type, with a CD coefficient for absciss and CL for ordinates.
- Set a first curve, selecting the tutorial's project and the analysis corresponding to the 0° flap deflection.
- Set a second curve, selecting the tutorial's project and the analysis corresponding to the 20° flap deflection.
- Click the 'Generate graph' button.

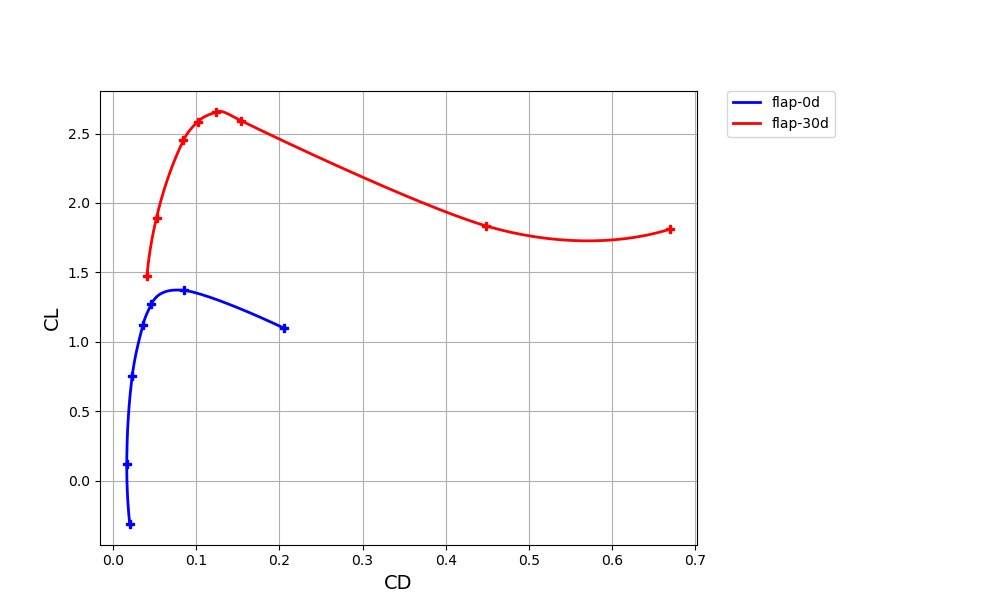
You should obtain this graph:

By changing the parameters, one could visualize only the lift force of the flap without the primary, exclude some runs, etc.


