To visualise the results of a particular run, you can use the magnifier icon in the queue ; or you can click on the projects tab, and opening in the left side tree view the right project and analysis, then selecting the right run.
If you visualise the first finished run, you should get the following informations:
- A summary of the parameters used in this run. Double check, everything is set as expected.
- A button to open a 3D visualisation, and a viewer to display automatically-generated images. Check in these iamges that everything is okay. The name starts by an indication of when the image was produced:
- 'STLview' images are produced first, the basicaly show the surfaces as the software imports them. It can be useful to se misplacement or missing parts errors.
- 'STLholeDetection' will show you detected holes in the surfaces. Some holes are okay, some are not.
- 'MeshView shows how the aire around the body was meshed, usefull to check the right volume was meshed. if the inside of the airfoil is meshed, there is a problem, a hole in the surfaces given most likely.
- 'Solution' are images generated at the end, showing final airflow solution.
- A automatic mesh check.
- The aerodynamic coefficients for this run. If you use the export button, this will give you a .csv file with a lot more details. In this csv file you will have seperated forces for the different parts, values of pressure and viscous forces seperated, etc. Check the value are of expected order.
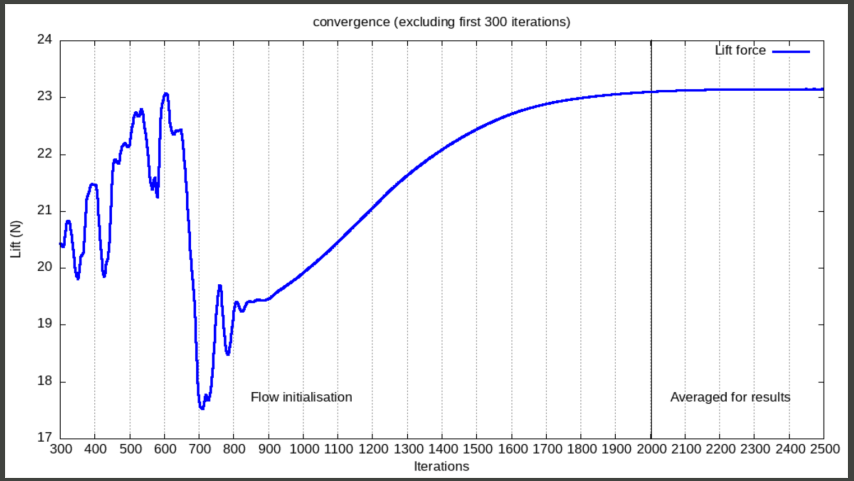
- An image viewer displaying convergence for the model equations and for the main results (drag, lift, maximum air speed found around the object). Near the end of the computation, the result must be stable. Oscilations of very small amplitude are acceptable. But there should be as less drifting as possible.
- A indication of how much RAM was used during the run. If it shows 100%, the computation probably failed by lack of RAM. If it indicates something above 90% be wary that any small design variation may make you go above the limit. It is better in this case to make another reference that requires less ram (smaller detail-size parameter during project creation).
- A list of logs of all openFOAM operations executed. These logs may contains important warnings and errors. If it is the case they will be highlighted by the UI.
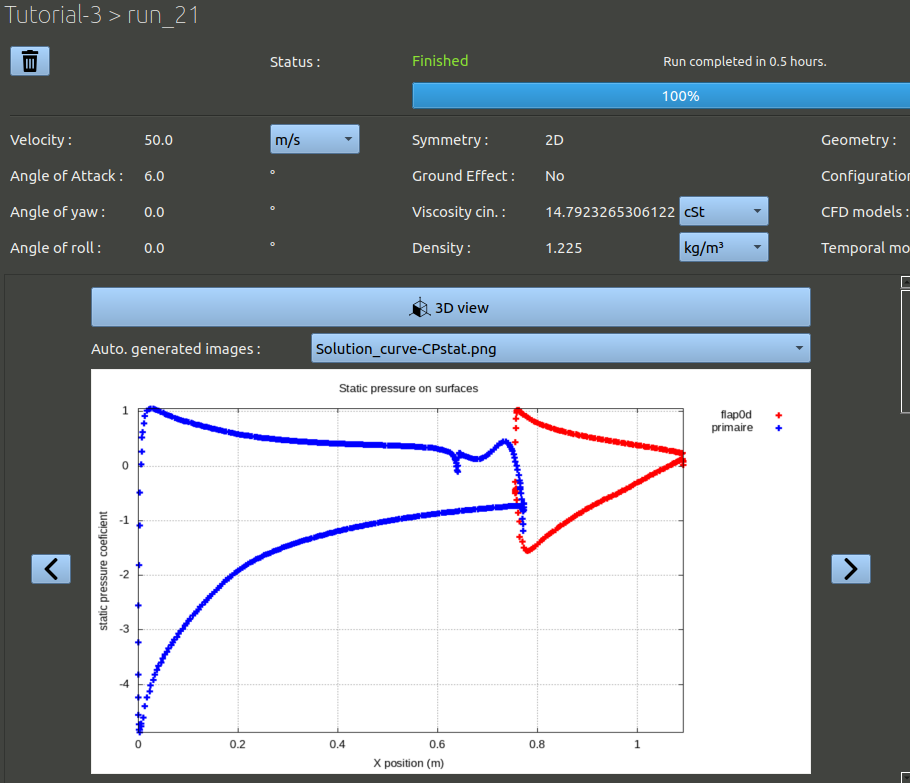
NB: to inspect the aerodynamics of airfoils, an automatically generated image is very useful. In the top image viewers select the Solution-curve-CPstat.png image. This is a plot of static pressure coefficient along the chord.
Always check the convergence plots as well. For the run to be accurate, the values after the last vertical bar should be stable, as these are the values averaged to produce the final aerodynamic coefficients and fields that can be visualized in the 3D view. If the end of the plot does not give stable values, the solving duration parameters in the configuration definition should be updated to make more iterations, or the mesh should be refined.