Next: About this document ... Up: tuto Previous: 5 Improving the engine Contents
Let's have a look at the results and compare the two versions.
In the project bar, select one analysis and naviguate through the tabs "Heat-exchangers", "Rotors", "Report-surfaces". From these tabs, we obtain the mass-flow rate through the exchanger, the thrust computed from the propeller and the flow rate through the report-surfaces.
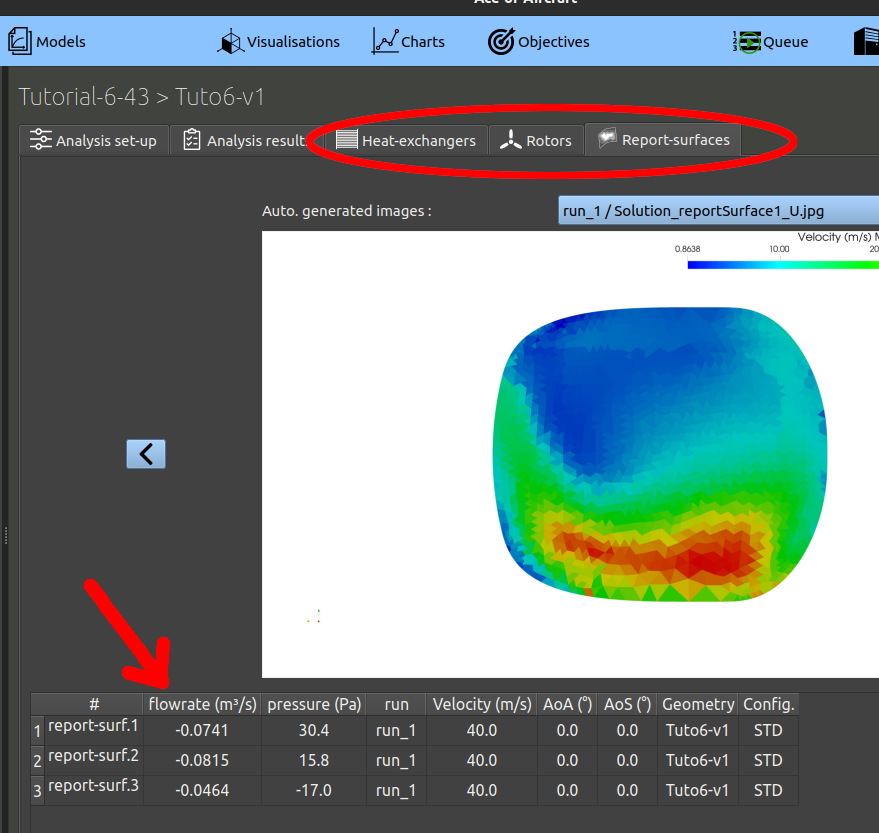
We note that more flow comes on the lateral report surfaces (1 and 2) slightly decreased in the v2 compared to v1. this could mean the cooling of the engine cylinders changed, we will check that later.
We can also note in the table of the heat-exchangers, that the estimated cooling on the radiator increased significantly :from 0.73 kW for the v1, to 0.98 kW for the v2. This is 34% increase!
Let's check the cooling perfomance on the engine cylinders from air friction data.
This .csv contains lots of useful information about your simulation.
Naviguate to the bottom of the document and read the skin friction reports: this represents the magnitude of the airspeed in the closest proximity of the parts selected, and can give a rough idea of the cooling performance. This figure is built by making a surface integral of the wall shear stresses magnitude on the faces of the selected parts.
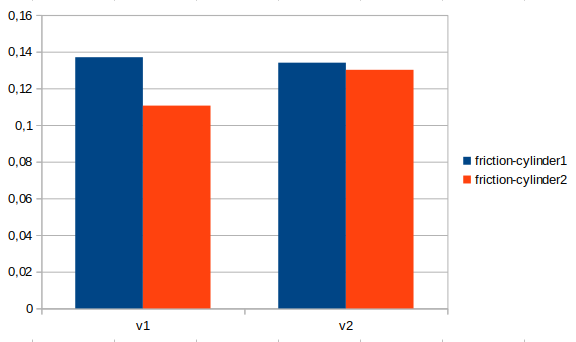
From the skin friction reports on the cylinder heads, the v2 has a better air-cooling on the cylinder. Also, the left/right difference in friction decreased. While this result is not given in kW of heat exchange, checking this levels at each design iteration, or comparing them to a reference case, can give an indication of the progress made on air-cooling.