Here is a quick guide on how to visualise results about rotors and aerodynamic torsors. The rotors data is aggregated in a tab of the analysis, to let the user quickly check if something is wrong in one calculation.
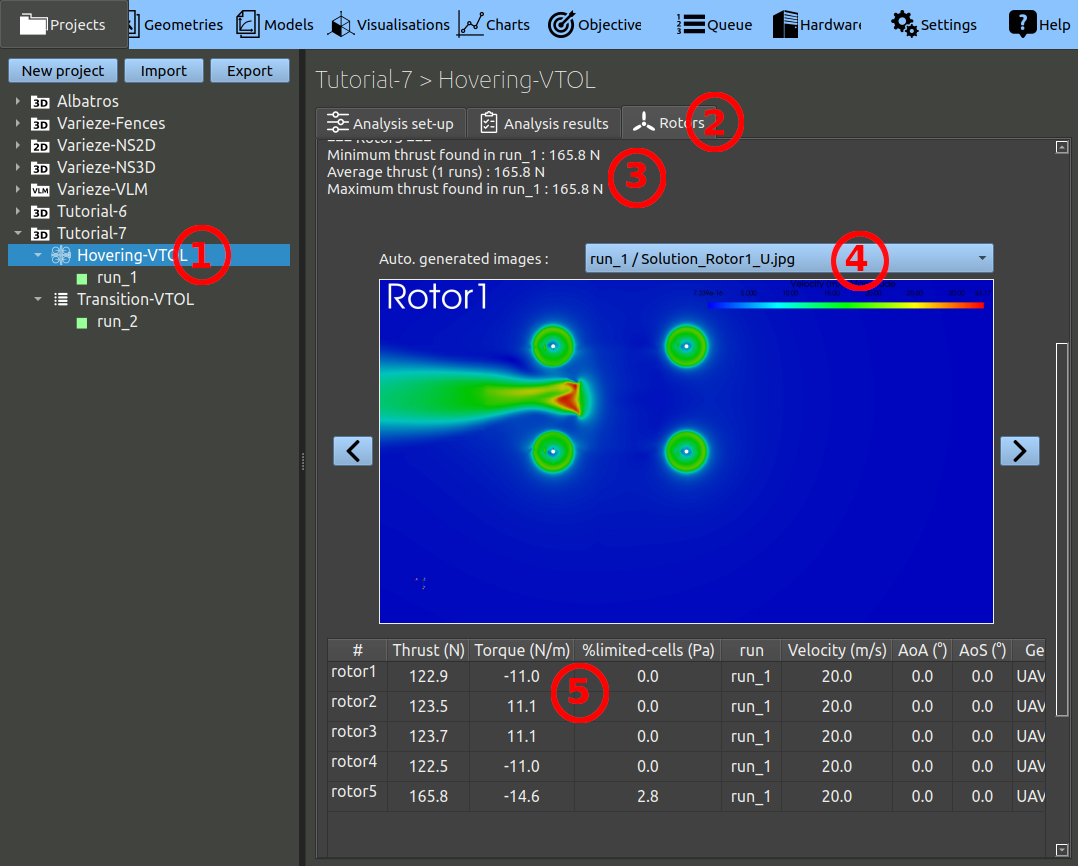
- In the Project tab, select the analysis in the left frame.
- Then select the "Rotors" tab.
- At the top of this page, you will find the min/average/max thrust values for each rotor, in all runs. This is to help you track the rotor thrust is behaving as expected.
- In the middle of the page you will get an image viewer, displaying various data about the rotor. This image can help you with your quality analysis. For example you can select the image "run_1 / Solution_Rotor5_bladeAoA.jpg", and observe that the blade angle goes up to 25°, because the flow is blocked for a part of this push-propeller disk, and the propeller stalls when passing behind the engine.
- At the bottom, a table sums up the Rotor data, for all runs. Note the column "limited cells". A limited cell is a cell in the rotor zone where the blade angle of attack was computed to be very high or very low, and this value of blade angle of attack was forcefully brought back within a reasonable range when computing the air acceleration. This safeguard is typically activated near the rotor hub. This value is a percentage of cells in the rotor zone for which this limitation was used. Above 10 percent, there is likely something wrong in the modeling.
You can click the "analysis results tab". On that page you will get a table of parameters and general results. Then click the export button at the bottom of the page to export a xlsx file containing more details. The address of the exported file will be displayed near the button when you click it.
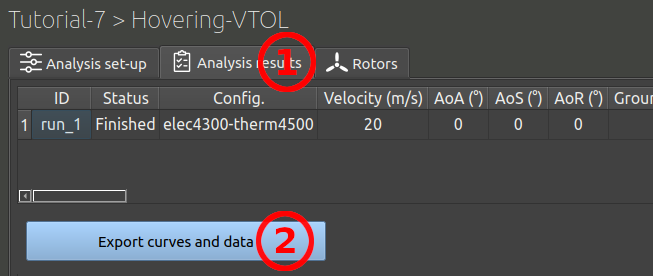
In the xlsx file there are multiple tab. The first one is a summary of the results, the same table as in the ace-of-aircraft window. However there are more detailed information in the other tabs.
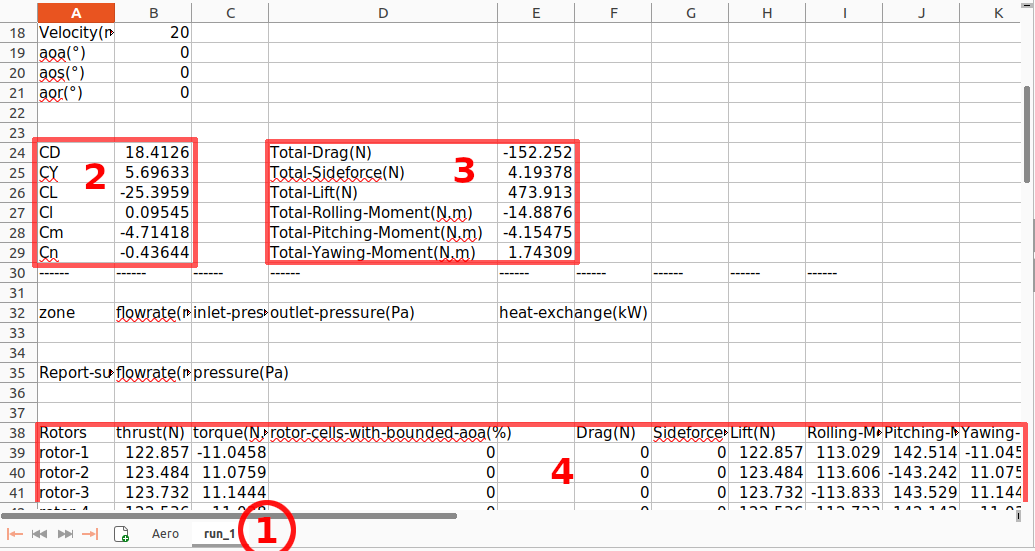
- Click a run tab at the bottom.
- The aerodynamic coefficients are computed without considering the thrust and torque of the rotors. Also note that in the hovering case, there is no velocity to compute these coefficients and they don't mean anything.
- A second part of the table gives the global aero torsor, including the rotors forces and moments. The "Total Drag" value in this case will give the forward acceleration, mainly coming from the push propeller.
- A bit bellow you will find a table giving the detail for each rotor. Even more below the detail of the aerodynamic forces and moments for each parts.
In this case we are investigating the VTOL to horizontal flight transition and we are mainly interested by two values:
- We want to make sure the lift remains above 450N in all cases to counter the weight of the aircraft.
- We want the pitching moment to remain as neutral as possible to be sure we can maintain the stability.
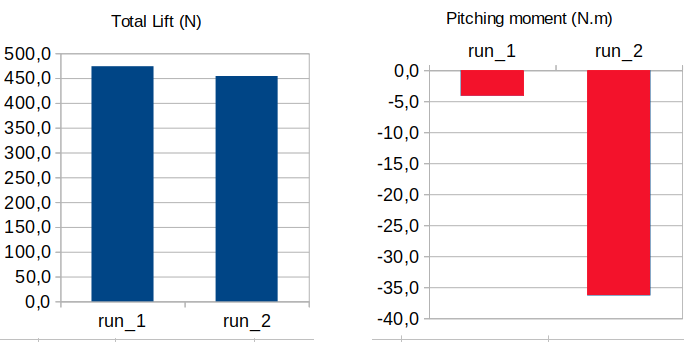
The lift is maintained but drops slightly on run_2 (the 24m/s case), a bit more speed is needed before shutting down the VTOL motors. However, in run_2 a nose-down moment will be created. Looking deeper in the figures we can see the thrust of the 4 VTOL rotors are balanced, the moment is produced the wing. The issue should be investigated further neutral point of the wing should be checked.