Next: About this document ... Up: tuto Previous: 6 VLM analysis set-up Contents
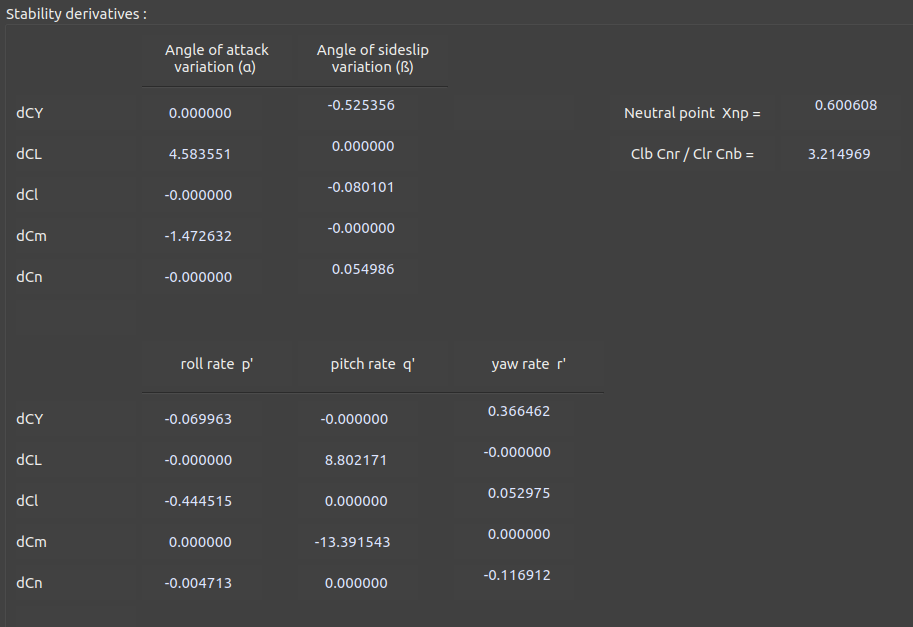
Once the VLM computations are done, go to the "Analysis results" tab to visualize the table. At the bottom, the command derivatives data remain empty because no control surfaces was defined for this geometry. You should obtain this table:
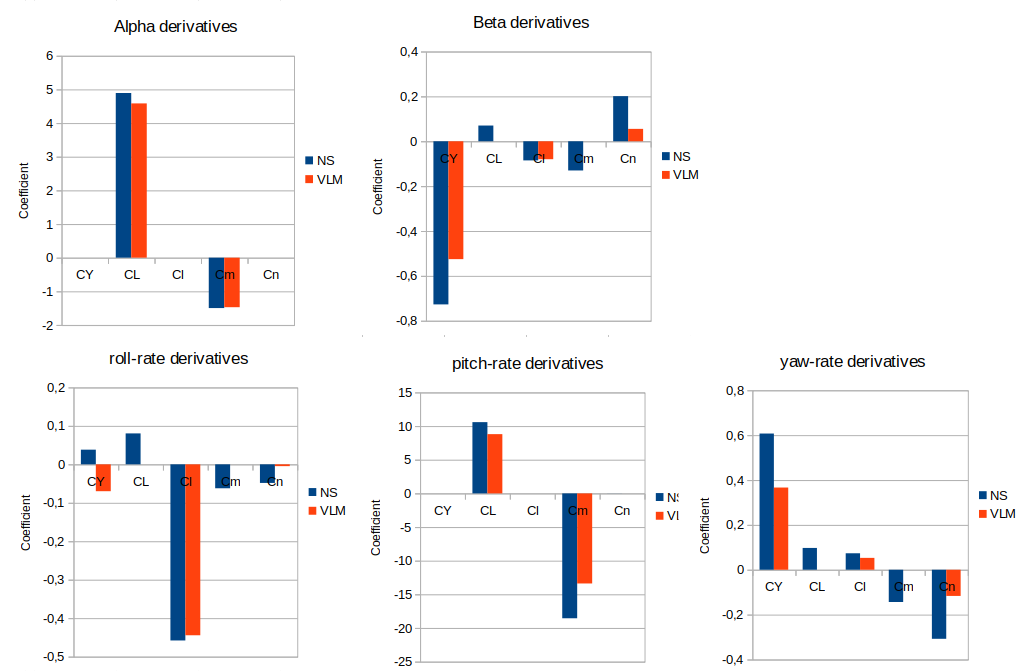
We can compare them as in the following image. Main axis are generally good correlation between NS and VLM, but secondary axis and Cn can be different. Which can be explained by the differences of modeling techniques.