Next: 7 Check the dynamic Up: tuto Previous: 5 Create a configuration Contents
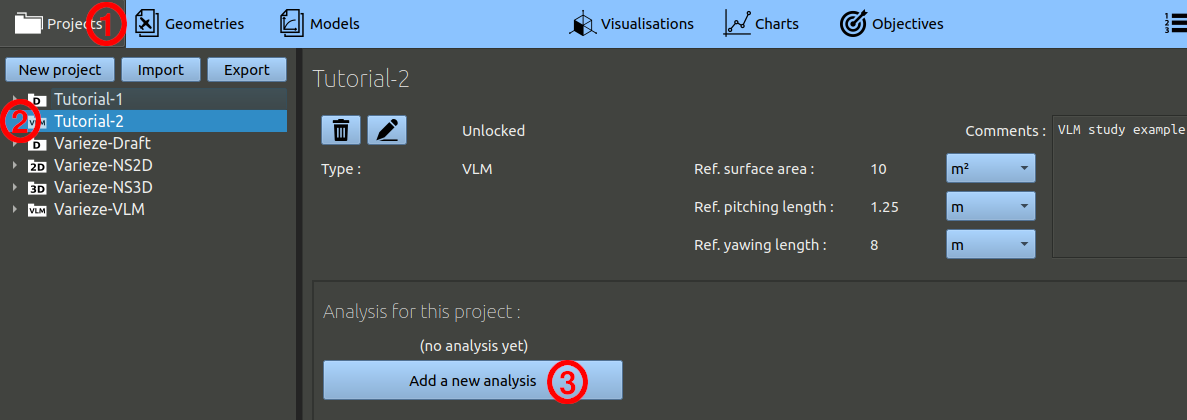
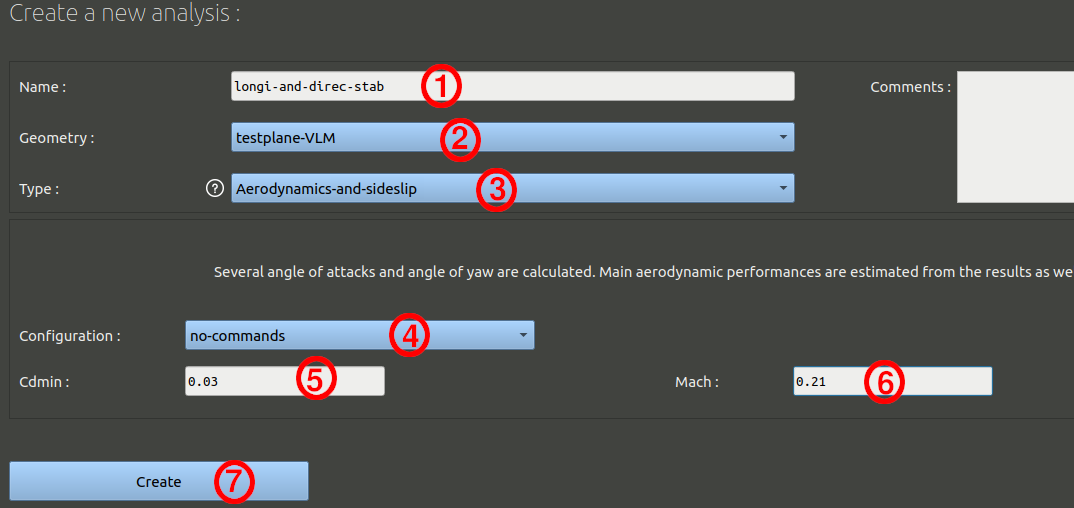
The computations will take a couple of minutes. You can re-select the analysis in the tree on the left side of the window to refresh the page and update the progress.
When the runs are completed, you can click on the 'Analysis results' tab, and scroll down to the Momentum curves.
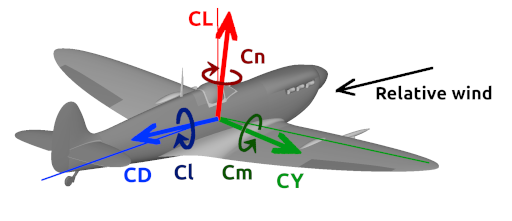
NB: here is the referential frame and positive directions used in the software for aerodynamic coefficients:
Click on the edit button to add other values of centres of gravity. Below is an example computed with the to others CoG given in the first chapter:
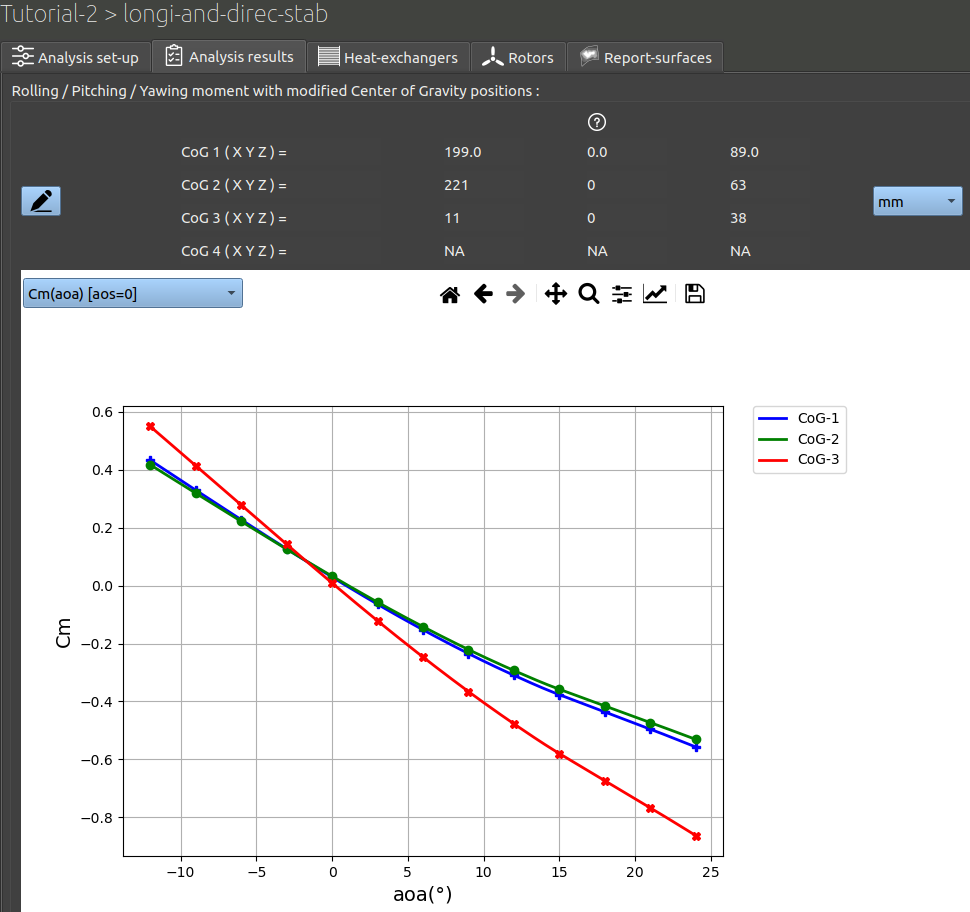
The aircraft is stable for the 3 CoGs values given, as the pitching moment Cm is negative for positive angles, and conversely.
NB: VLM modeling cannot predict stall effects.
You can modify the value of the blue entry on top of the chart to select the Cn moment instead of the Cm moment. The plot will update and show positive Cn values for positive angles of sideslip, and conversely. This means the aircraft is stable vertically too.
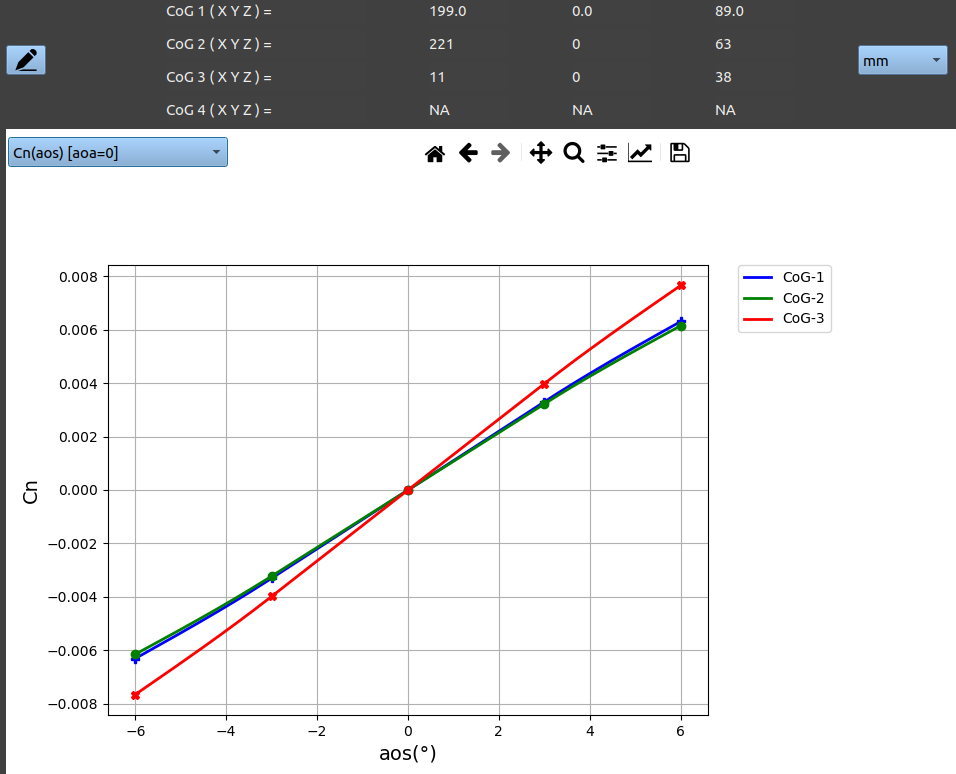
You can tweak the CoG values plotted and by trial and error find the CoG position where the stability is broken. It should be around X +1000 mm for the directional stability and X +650 mm for the longitudinal stability.